当前位置
RAND Corporation report on Public Cord Blood Banking Industry
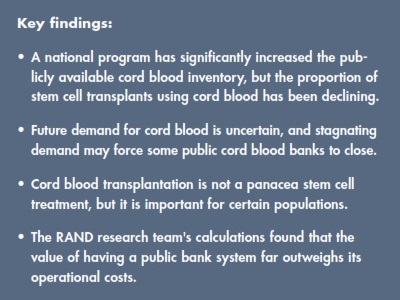
 The RAND Corporation was commissioned by the U.S. Department of Health and Human Services to conduct a study on the Sustainability of the U.S. Public Cord Blood System. When the report was announced in late Sept 2017, members of the cord blood industry were heartened by the sub-title of the Research Brief: Worthy of National Investment. This article splices together and condenses insights from the full 156 page report.
The U.S. federal government created the National Cord Blood Inventory (NCBI) program in 2005 to increase the number of high-quality cord blood units (CBU) available through public cord blood banks (CBB) so that anyone needing a stem cell transplant would have a chance to find one. The legislation authorizing the program set a goal inventory of 150,000 public CBU. As of 2016, it is estimated that over 710,000 CBUs are currently available in public CBBs worldwide, of which 235,000 are in the U.S.
In terms of quality, the total nucleated cell (TNC) count of a CBU is one of the most important measures: Clinical guidelines recommend a minimum TNC count of 25 million per kg of patient weight. In the U.S., the average adult female weighs 75 kg and requires a dose of at least 1.87 billion TNC, while the average adult male weighing 89 kg requires at least 2.22 billion TNC.
Most of the CBU in the U.S. inventory are too small to transplant adult citizens without resorting to a double cord blood transplant. About half of the current national inventory is made up of CBUs that have TNC counts less than 1.25 billion, and only about 15% of the CBU have TNC counts above 1.75 billion. Looking at CBU that were released for transplant during the decade from 2007 through 2016, only 11% had a TNC count below 1.25 billion, 28% had a TNC count between 1.25 - 1.75 billion, and 59% had TNC counts over 1.75 billion. In other words, about 15% of the inventory supplied nearly 60% of cord blood transplants. This has led one cord blood banker to say that transplant centers are “fishing from one end of the pond”.
The RAND Corporation has quantified the likelihood of a CBU being used, as a function of TNC count: The probability of a CBU with a TNC count of 1.25 billion being transplanted is only about 0.1% per year, or cumulatively an 11% chance that it will ever be used. The cumulative probability takes into account that CBU are not considered to have an expiration date. By comparison, a CBU with a TNC count over 1.5 billion has a 1-3 % chance per year of being used, and a cumulative 61% probability that it will eventually be used.
The average fee that a U.S. public bank charges a transplant center for a CBU is $36,200 (the range is from $29,000 to $45,000), and the banks currently do not scale their prices according to the TNC count or genetic rarity of the CBU. The cost to collect each public CBU is between $1,700 and $3,100.
As part of their NCBI contracts, the public banks receive a subsidy of $1,200 every time they store an eligible CBU and register it with the Be The Match® Registry, operated by the National Marrow Donor Program. The minimum TNC threshold for a CBU to receive the subsidy is currently set to 0.9 billion, which is only sufficient to transplant a child weighing 32 kg or less.
“The current structure of the NCBI program implicitly creates competing demands for public CBB because the goal of increasing the quantity of units in the inventory is often at odds with increasing the average quality (TNC count) of the units.” The public CBB have a short term financial incentive to bank all CBU that qualify for the NCBI subsidy, but in order to achieve long term financial sustainability they should only bank CBU that hold 1.5 billion cells or more and have the best chance of being transplanted.
The average number of donations collected per year by U.S. public CBB is 8,500 CBU but, depending on the bank procedures for collection and evaluation of donations, only between 5% and 40% of those CBU are ultimately banked. Thus, for public CBBs to financially break even, the NCBI subsidies received for banked CBU plus the fees collected for transplanted CBU should ideally cover the costs of all the CBUs collected, including discards and overhead costs. Economic models indicate that in order for public CBB to break even, within a national inventory of 150,000 CBU, the price of each transplant CBU should be $46,000.
Overall, stem cell transplants have been on the rise for several years. Almost 8,700 stem cell transplants were performed in the U.S. during fiscal year 2015; this is up 23% over five years from 7,100 transplants in 2010. However, the fraction of stem cell transplants using cord blood has declined over this time period from 12% (822) in 2010 to 8% (718) in 2015.
As cord blood banking networks have grown in other countries, the U.S. share of the global market for transplant CBU has shrunk. The fraction of CBU released from public CBB that were exported to international patients has dropped from 24% in 2010 to 15% in 2015. Meanwhile, the use of imported CBU for cord blood transplants in the U.S. has risen from about 18% in 2010 to 24% in 2015.
The RAND Corporation estimated that the average hospital charges in 2014 for a stem cell transplant from an unrelated donor (and duration of hospital stay) was $485,000 (38 days), $571,000 (34 days), and $831,000 (51 days) for bone marrow, peripheral blood stem cells, and cord blood, respectively. Approximately 43% of all cord blood transplants are pediatric patients and 57% are adults. The RAND Corporation further calculated that a cord blood transplant increases life expectancy, relative to no treatment, by 5 years for adult patients and 23 years for pediatric patients, assuming that survival does not depend on the antigen match of the cord blood transplant (HLA 6/6 versus 5/6 or 4/6).
Current research suggests that cord blood transplants may have better long-term outcomes than bone marrow and peripheral blood stem cells, and therefore lower long-term costs. However, long-term costs are not the bottom line for the health insurance companies who pay for transplant costs at the time of care, especially considering that U.S. citizens tend to change private insurance providers every few years.
“Public CBBs provide a quasi-public good… Specifically, all individuals with access to advanced health care derive an insurance benefit from the availability of the international inventory of CBUs as a potential treatment source for conditions treated using cord blood, as well as for conditions that may in the future be treated by cord blood.” (emphasis added)
To understand if government intervention in the U.S. public network of CBB is worthwhile, the RAND Corporation compared the social costs versus social benefits of the network. As proxy for the social costs they relied on the aggregate operating expenses of the banks. The social benefits fall into two categories: First, patients receive direct benefits from cord blood transplants in the form of increased life span and quality of life. Second, society receives indirect benefits from the insurance value of having an inventory. The RAND Corporation did not measure the indirect benefits, hence in this regard their calculation underestimates the net societal value of the U.S. national program. They also did not consider the option of sourcing cord blood from other countries, which would lower the value of the national inventory.
To learn more about the RAND Corporation report and their research team's recommendations for: the NCBI program structure, the reimbursement policies of the Centers for Medicare and Medicaid Services (CMS), and CBB operations, read their Report and/or the Research Brief.


 RAND Health